Taking a look at temperature profiles for cold and hot process soap.
Last month we looked at the possibility of using very high temperatures to shorten the time needed to completely saponify an oil. In extreme cases, this may happen in as little as 5 minutes. One might assume that “hot process” (HP) and “cold process” (CP) soaps differ in the temperatues used, but the designations have more to do with technique than temperature.
In the hot process, oils and lye are mixed in a container capable of applying heat to the mixture. The source of heat might be a crock pot, microwave oven, conventional oven, or hotplate. The soap batter is typically heated until it reaches gel phase and the saponification reaction is complete. Interestingly, it is possible to make HP soap at low temperature by using only gentle heat.
In the cold process, oils and lye may be heated, but no external heat is applied after they are mixed. The bulk of the saponification reaction happens in the mold. Also interestingly, it is possible to make a CP soap at high temperature just by heating the oil, as described last month. Here we will explore the relationship between time and temperature.
Typically when lye is mixed with oil, the mixture becomes gradually more viscous until it reaches trace. The batter then continues to thicken until it no longer flows. At this point it is essentially a solid. But if conditions are right, the solid soap remelts, a condition called “gel phase” by handcrafted soapmakers, and “neat soap” by commodity soap chemists. The temperature at which this phase transition happens depends on the oils used and the lye concentration.
Consider, for example, our standard four-oil blend: coconut oil 28%, palm oil 28%, olive oil 39%, castor oil 5%. We can make soap from this oil using lye with a wide range of concentrations. A medium-water soap, typical of what many people use, might use lye with a concentration of 33% NaOH. A low-water soap, (often referred to as a “water discount”) might use lye with a concentration of 40% NaOH. The temperature profiles of these soaps depend on the starting temperature when the oils are mixed with the lye.
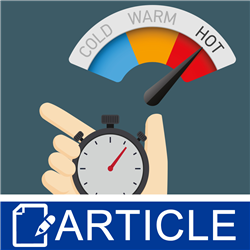
A temperature profile is a useful way to characterize a soap formula. Simply heat the oil to the starting temperature you wish to explore and, after mixing with your lye, measure the temperature periodically over the course of a couple of hours. An infrared thermometer is particularly convenient for this task, since you just point and click to take a reading. A stopwatch (perhaps on your smartphone) is convenient for measuring time.
You don't have to hit an exact starting temperature, and the lye need not be at the same temperature as the oil. For example, you might intend to start at 100°F, but because your lye is at room temperature, you could wind up at 95°F after mixing. Just record the actual time and temperature. You will want to record the temperature frequently (about once per minute) at the beginning when the temperature is changing rapidly. You can then record less frequently as the soap slowly cools. It is not important to hit any particular time or temperature. Just record the actual time and temperature as close to one another as possible. If you notice the soap moving into gel phase, be sure to make a note of it.
Figure 1 shows a temperature profile for a medium-water soap. The horizontal line at 71°C (160°F) marks the division between gel phase and solid soap. The soaps labeled 40°C and 60°C never get warm enough to reach gel phase. They gradually warm as the exothermic saponification reaction proceeds. Eventually, the heat produced by the reaction is less than that lost to the surroundings, and the soaps slowly cool. The soap labeled 65°C gradually warms until it reaches gel phase. Then the reaction takes off, climbing well above the gel temperature. The two hot soaps start above the gel temperature and the saponification reaction proceeds very rapidly. They hit peak temperatures in a matter of minutes, and once saponification is complete, they cool more rapidly than the other soaps because no further heat is coming from the reaction.
Figure 2 shows a temperature profile for a low-water (water discounted) soap. With a lye concentration of 40%, this soap gels at 87°C (189°F), much higher than the medium-water soap does. While the soaps labeled 40°C, 60°C, and 65°C get hotter than the corresponding medium-water soaps, they do not reach this higher gel temperature. Only the two hottest soaps reach gel phase, and they do so very quickly.
The specific temperature for the gel phase transition depends on the oils used as well as the lye concentration, but the general trend is that the gel temperature increases as the lye concentration increases. At the same time, soaps made with high-concentration lye get hotter than those with low-concentration lye, and they do so more quickly. Whether or not a soap gels depends on whether the soap reaches the gel temperature. The temperature profile also gives you a clue as to how quickly the saponificiation reaction is completed. When the temperature reaches its peak and begins to decline, it is because heat is being lost to the surroundings more rapidly than it is being produced by the reaction.
The temperature profile can also be used to diagnose problems with ingredients that are adversely affected by high temperatures. While measuring the profile on a batch, notice the temperature at which the adverse effect takes place. In subsequent batches, you can gradually decrease the starting temperature or decrease the lye concentration to prevent the soap from getting too hot.
The temperature profile is very easy to add to a batch record. It requires only a thermometer, a stopwatch, and a few extra minutes to write down the time and temperature. You can plot the data on graph paper or using a spreadsheet, or you can just look at the data without plotting it. While you may not bother to record it for every batch, it can be useful for diagnosing problems and solving them.
Footnote:
1. Data in this article were collected by students John Campbell, Andrew Basinger, Tyler Bowman, and Ron Davis under the supervision of Kevin Dunn. Parts of it are documented in Chapter 22 of Scientific Soapmaking (Kevin Dunn, Clavicula Press, 2010).